Photodiode Experiment Results#
The photodiode experiment allows for the precise temporal offset between the software-generated trigger and the physical event’s onset. This calculated latency can then be systematically applied to correct the event timestamps in the dataset, ensuring accurate alignment with the ground truth.
For easier interpretation, we provide a tool in lsl-tools that creates a visual plot of the experiment’s results. Please read over the README for more information on using this tool.
Generate the results visualization#
First, locate the results file created by the photodiode experiment.
Then, execute the command below with that file:
python tools/display/offset.py --filepath="yourfile.csv"
Executing this command will generate two plots and a statistical summary. The first plot displays the trigger events by sample number, while the second illustrates the distribution of the measured timing offsets. The accompanying table provides key descriptive statistics for these offset values, such as the mean, standard deviation, and min/max.
Results Visualization#
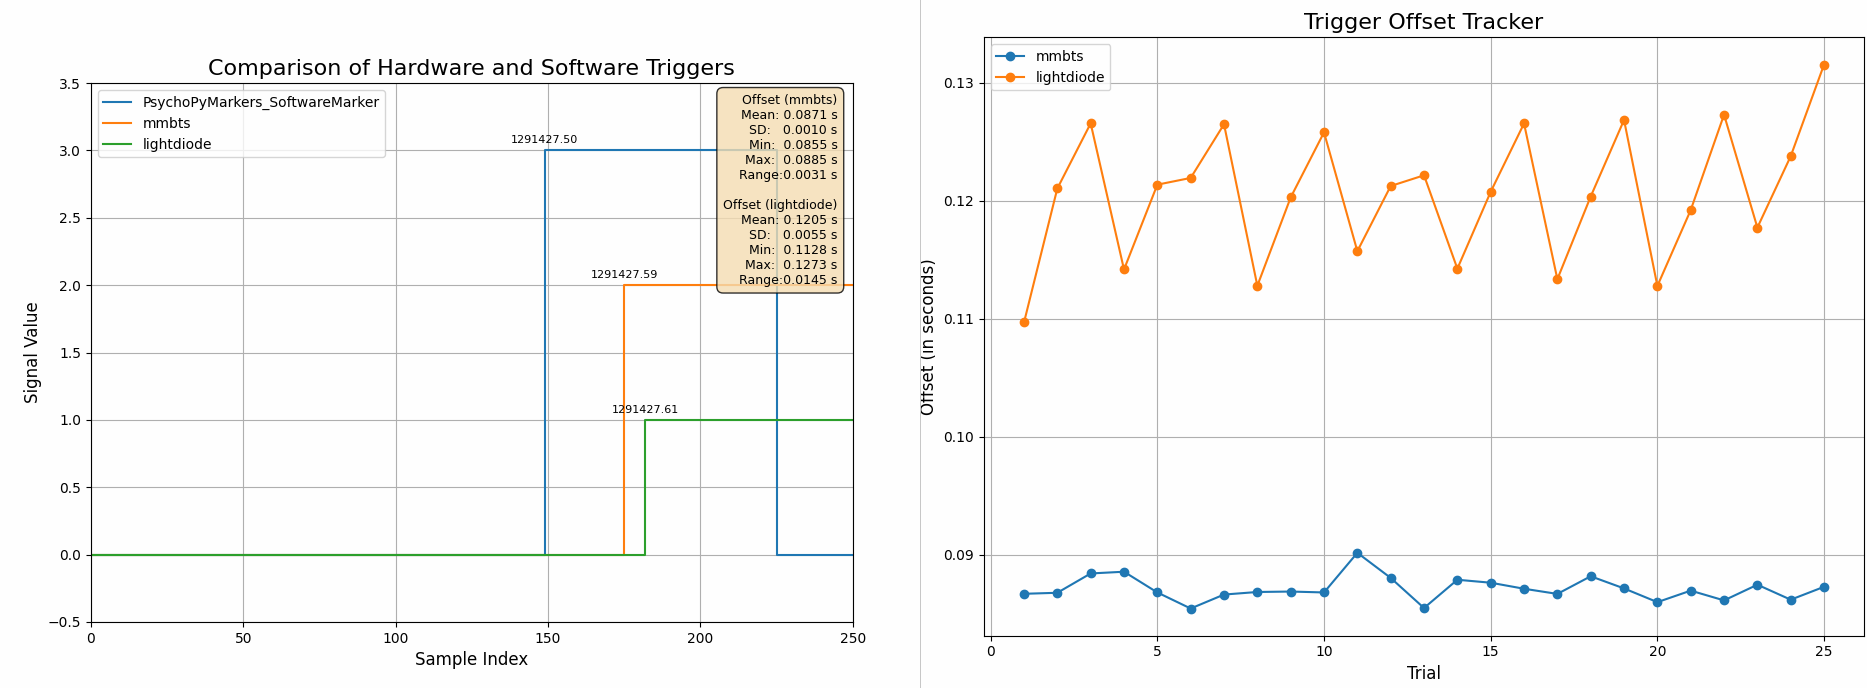
The results visualization generates two figures: Comparison of Hardware and Software Trigger (left) and Trigger Offset Tracker (right).
In the left figure, there are three triggers presented:
Trigger 1 represents the lightdiode (the actual event) indicated as a green line.
Trigger 2 represents the MMBT-S hardware trigger indicated as an orange line.
Trigger 3 represents the software triggers coming from LSL indicated as a blue line.
From the figure you can see that the software and hardware triggers occur before the actual photodiode event with a mean of 0.0871 seconds and 0.1205 seconds respectively. You can adjust the data accordingly to this offset online or offline to get the most accurate trigger timings.
In the right figure, it can be seen that the offset is stable over the trials (no drift) with the MMBT-S hardware trigger producing the most stable results.
Timing requirements for EEG and ERP analyses
The exact offset and variability values may vary depending on your specific setup and environment.
The timing variability demonstrated above is low enough to ensure reliable alignment for most EEG or ERP analyses. Your analysis may require additional calibration or adjustment based on your specific hardware and experimental conditions. Please reach out to us if you have any questions or need further assistance.