Analyzing the Photodiode Experiment#
The photodiode experiment quantifies the precise temporal offset between the software-generated trigger and the physical event’s onset. This calculated latency can then be systematically applied to correct the event timestamps in the dataset, ensuring accurate alignment with the ground truth.
For easier interpretation, we provide a tool in lsl-tools that creates a visual plot of the experiment’s results.
Generate the Visualization#
First, locate the results file created by the photodiode experiment.
Then, execute the command below with that file:
python tools/display/offset.py --filepath="yourfile.csv"
Executing this command will generate two plots and a statistical summary. The first plot displays the trigger events by sample number, while the second illustrates the distribution of the measured timing offsets. The accompanying table provides key descriptive statistics for these offset values, such as the mean, standard deviation, and min/max.
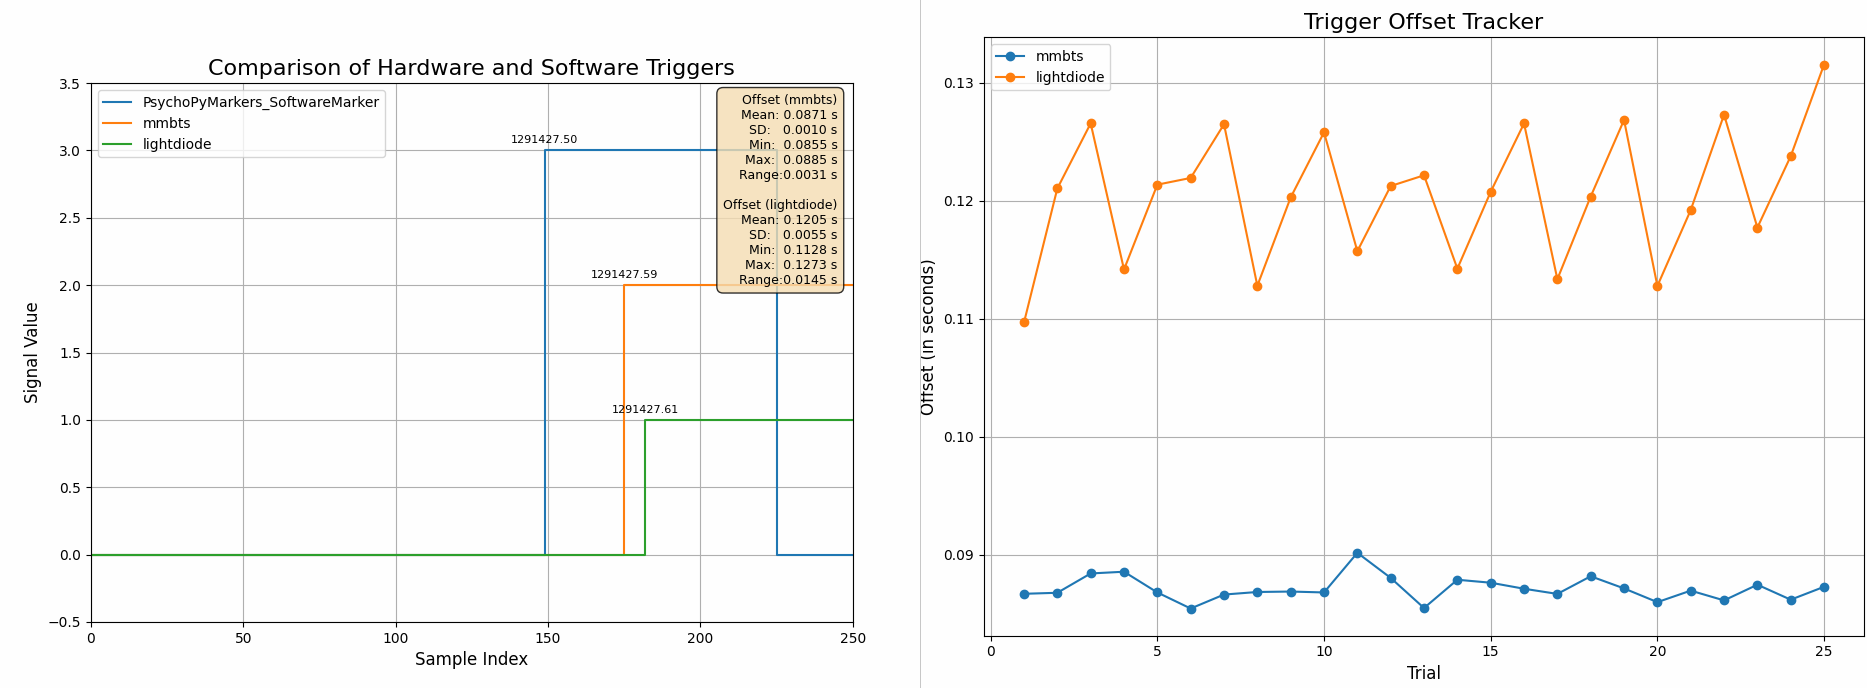
The image above shows the two graphs. In this example, there are three triggers. Trigger 1 represents the lightdiode (the actual event), trigger 2 represents the MMBTS hardware trigger, and trigger 3 represents the software trigger. From the graph you can see that the software and hardware trigger occurs before the actual event. You can adjust the data accordingly to this offset. The two offset difference lines are the offset difference between MMBTS vs lightdiode and software vs lightdiode.